Introduction
What are we doing as software developers? Nothing else than translating the language of humans into the language of computers. The language of the humans is any spoken language, like English and the language of the computer is binary code. There’s a huge distance between the two. To achieve this huge distance we have to introduce some middle stages. One well known middle stage is the programming language itself: no one writes binary code, everyone uses some programming language. From this step to compiler (or in some cases the interpreter) will transform you code into a low level language (like Assembly) and then into binary code. But there is still a huge distance between the spoken human language and the programming language, it is a good idea to introduce some additional middle steps.
There are several options for such middle steps, some of them are closer to the human language and others are closer to the programming language. Examples for this middle stage are: writing informal requirement specification, writing formal specification (like design by contract), specifying your program by examples or model your program by UML.
What is UML?
UML is an abbreviation of Unified Modeling language. The history of UML started in the mid of the 90's and today we are at version 2.4.1. It has several alternative versions and extensions, like SysML. UML is modelling by using different types of diagrams. UML is the way of representation. Later on based on your goals you can draw UML diagrams by hand on a table or on a white board, by using paint or by using a professional UML editor. There are several UML editor tools, some of them are free for use (ex.: Umbrello), others costs a lot (ex.: Enterprise Architect). Some of them are just like a specialized drawing tool, others are including a lot of features, like version control, connections between diagrams or even code generation on a certain level.
I also tried out several free UML tools and it was really challenging to find one which can save the diagrams as pictures in a proper way and which can draw all types of diagrams in the standardized way.
The UML diagrams are categorized into two big groups: structural (or static) diagrams, which are representing the static architecture of the software and behavioural (or dynamic) diagrams, which are representing how your software works in different situations.
Below I made a short introduction into the most popular UML diagram types.
Different sorts of diagrams
Structural diagrams
The first big group of diagrams describe the structure of your software.
Component diagram

A component diagram stands for modelling the high level architecture or your code.
It’s main elements are the following:
- Components (ex.: User interface and Business logic on the diagram)
- Ports of components: ports are marked by a small rectangle on the side of a component (see “Attributes” on the side of User interface called). They are an interface to other components, basically a collection of provided interfaces.
- Provided interface: provided interface is represented by a circle connected to the component. These are basically the interface functions of the component which can be reached from outside.
- Required interface: it is represented by a half-circle connected to the component. That means the the components requires an interface provided by another component. So that required and provided interfaces can be connected to each other.
Class diagram
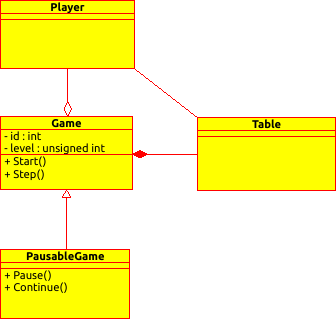
The most frequently used UML diagram is the class diagram. It is representing the class hierarchy of your program or a part of your program.
Each class is represented by a rectangle, the name of the class is written on the top of the class. To represent interface classes an additional rectangle should be put on the top right corner.
After the name of the class there’s a section for the attributes (variables) of the class. The visibility of the attribute can be represented by a - (private) or + (public). Then comes the name, “:” mark and the type of the attribute.
The next section represents the operations (functions and methods) of the class.
In several cases the class diagram simple ignores the attributes and/or the operations and concentrates only on the connection of different classes.
The classes can be connected to each other in four different ways:
- Composition: it is represented by a filled and rotated rectangle on the side of the class connected to a different class (like between Game and Table). It means that Table is part of the Game, it is a part of it. They lifetime is the same (they are created and destroyed at the same time). Practically it means that Game has a member variable of an instance of Table. Multiplicity can be added by adding numbers on the connection (if the game had multiple players), * means “any amount” of connections. An example of the real world: between a human and its head, there’s a composition: they have the same lifetime and the had can not be assigned to someone else.
- Aggregation: it is represented by an unfilled and rotated rectangle on the side of the class connected to a different class (like between Game and Player). It means that the classes are connected to each other, but they lifetime can differ. It means the Game has a Player. But the lifetime of a Player and Game is different and the Player can be assigned to different games as well or even the Game can change its Player during the time. Multiplicity is the same as for composition. In the world of code it means Game has a pointer to a Player. From real life it means that between my clothes and me there’s an aggregation: I need clothes, but I’m changing them regularly and even the clothes can be worn by others.
- Association: association is marked by a single line between two classes. (like Player and Table), or sometimes with a single arrow. It means that the classes are using each other, but not owning, like they have a local instance in one of the functions, or it is used as a function parameter or return value. It is like if I take the bus, then I am just using the bus, it is a typical case of association.
- Generalization: generalization is represented by a triangle-ended arrow (like between Game and PausableGame). It means that Game is a generalized version of PausableGame or with other words PausableGame is a specialized version of Game. In the world of code it usually means inheritance. And as for example for the real world: Animal in a generalized version of dogs and cats.
Object diagram
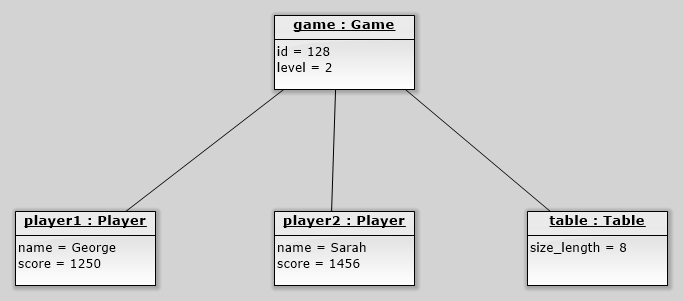
Object diagram is not so popular as class diagram, but it can also be really useful in some cases. It is representing the state of the objects (instances of classes) of an object oriented program in one dedicated point of time. Each object is represented by a rectangle. In the top part of the rectangle there’s the name of the object (“player1”) : Type of the object (Player). Below that you can list the attributes of the objects with their actual value. The objects can be connected to each other (like game has two players and a table).
Deployment diagram
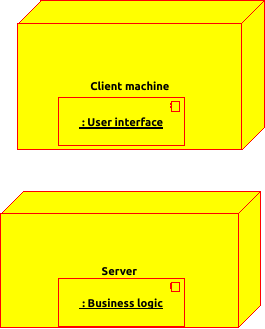
Deployment diagram is useful if your software is distributed on multiple different machines. You can add machines to the diagram (devices), like “Client machine” and “Server” on the picture and you can assign the software components to them which running on the given device.
Behavioural diagrams
The second big group of diagrams is the behavioural (dynamic) diagrams. Their purpose is to describe how the software behaves in different use cases.
Sequence diagram
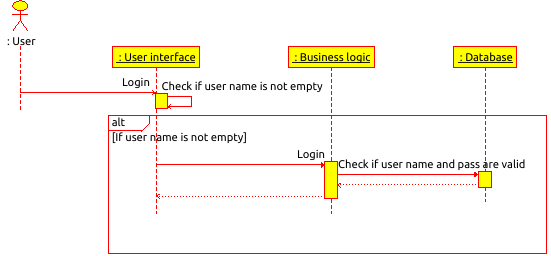
The sequence diagram describes the communication between the different object or software components in a dedicated use case.
The above example describes a login procedure in case of a web portal.
The first element in the top left corner is an actor, which represents the user itself. The user calls the Login method (clicks on the login button). The event will be handled by the user interface. This is represented by a rectangle. Here it is also possible to add an object : Type pair. The dashed line below is the life time of the object/component. In this case the life time is the same for all components, but it could differ from each other. It is also possible to create on object later by a dedicated call or destroy it earlier. In this case the life time line should of course shorter.
As the next step the user interface is calling itself to check if the user name form is not empty. After this call there’s a big red rectangle with the tag “alt” in the top left corner. This represents that the part inside the rectangle will be only executed if the condition “user name is not empty” is true. Otherwise it won’t run. Instead of alt we could also use a loop.
So if the given username is not empty the User interface calls the Business logic.
The business logic calls the Database to check if the username and password pair is correct. Then the database returns with a value (dotted line) and the Business logic also returns with a value.
Of course a sequence diagram can be done in a more or less detailed way.
Activity diagram

The diagram type called activity diagram is maybe the easiest one, since it is nothing else then a well formulated flow chart. The filled circle is always the start point of our program/algorithm. The flow of the program or algorithm is represented by arrows. The rounded rectangle (like “Ask for a number”) represents an activity. And the diamond represents a decision (in this case if the given number is positive). From the decision start always multiple arrows, which are labeled by the result of the decision (here Yes or No). In some representation there is also a merge element which is also a diamond. A merge element has always multiple incoming line and only one which is started from that. In this case I missed this element and I connected it back directly to the action “Ask for a number”.
The last element to mention is the filled circle inside the unfilled circle which is always the endpoint of the program of algorithm. A program can have multiple endpoints.
So the above diagram represents a short program which is keep on asking for a number until the given number is not positive.
State diagram
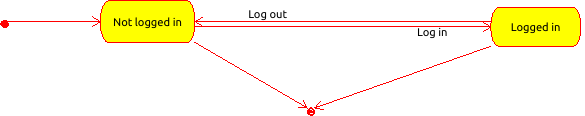
The state diagram is used to represent state machines. The start point and end point is represented similarly as in the activity diagram. The transmissions are represented by arrows. The dedicated states of the program are marked with rounded rectangles. The state machine can also have multiple end points. It is also possible to have parallel states or add substates to an already existing state. The advantage of this representation of your program is that it’s giving a good, human readable overview and at the same time, it's easy to convert it into source code.
The above diagram means that at the start of the program is in a “Not logged in” state, by logging in we can change to the “Logged in” state, from that by logging out we can change back to the “Not logged in” state. From both state we can reach the end state of the program.
Use case diagram
The use case diagram is any light weight representation of the functionality or a part of the functionality of the program from the view of the user.
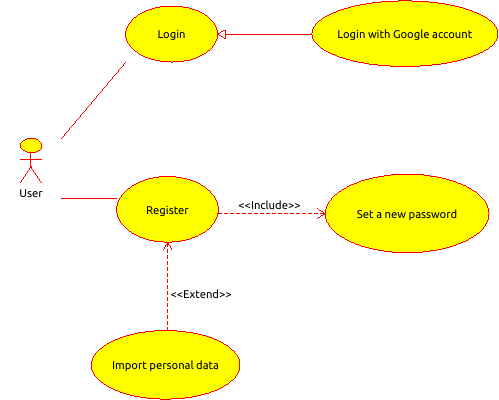
The so called actor is represented by a stick figure, in the case of this diagram we call it “User”. It is also possible to have multiple actors (like users with different permissions) and it can also be the case that the actor doesn’t represent a human, but another system using our program.
The functionalities which can be used are called use cases. They are represented by an ellipse and they can be connected by a line directly to the actor or they can be also connected to an other use case by specific connectors. In case of the example we have to main use cases: Login and Register.
The connectors between use cases can be the followings:
- Generalization: it is very similar as in the case of class diagram, it is even represented in the same way. The general use case can have one or more specialized versions. Like in the example the use case “Login” has a specialized version “Login with Google account”
- Include: include connector means that one use case (functionality) is part of an other one. Like “Set a new password” is part of the functionality “Register”. It is represented by a dashed line with a label of <
>. - Extend: Extend means that one use case is an extension of the other. For example the option of “Import personal data” is an extension of the use case “Register”. It is represented by a dashed line with a label of <
>. - Precedes: One connector is missing from the example and this one is called precedes. By usage of precedes connector it is possible to define the order of the use cases. We could add a precedes connector between Register and Login, since to be able to log in first you have to register. It is represented by a dashed line with a label of <
>.
Use case diagram is a perfect tool to represent the high level functionality of the program in a human readable way.
Summary
UML is a pretty strong tool to represent the software in a human readable format. It is a good basis also for technical discussions. However it should be considered that pretty often the same things are represented in different ways, since it is just semi-formal.

No comments:
Post a Comment